Roast Profile
A Roast Profile is a Bean Temperature curve defined by specific Time and Temperature points called Anchor Points. Editing a Roast Profile is accomplished by changing the placement and number of Anchor Points.
Roast Profiles can be used in varying ways, which you may consider when designing, saving, and naming the file. The Profile will be saved with the file type that corresponds to the Edit mode toggled at the time of saving (either Roast Profile or Burner Recipe) and this file type may influence its file location when uploaded to a Roaster. A Loring Roaster operating in 'Profile Roast' Mode will automatically follow the Bean Temperature curve using the PID system. If operating in 'Manual' mode, the Roaster will display the Bean Temperature Curve on the Roaster screen for reference, but will not automatically follow the curve. If Burner Recipe data is present in the Profile, it can also be run as a Burner Recipe on a Loring Roaster. See your Roaster Owner's Manual for more information.
Viewing a Roast Profile
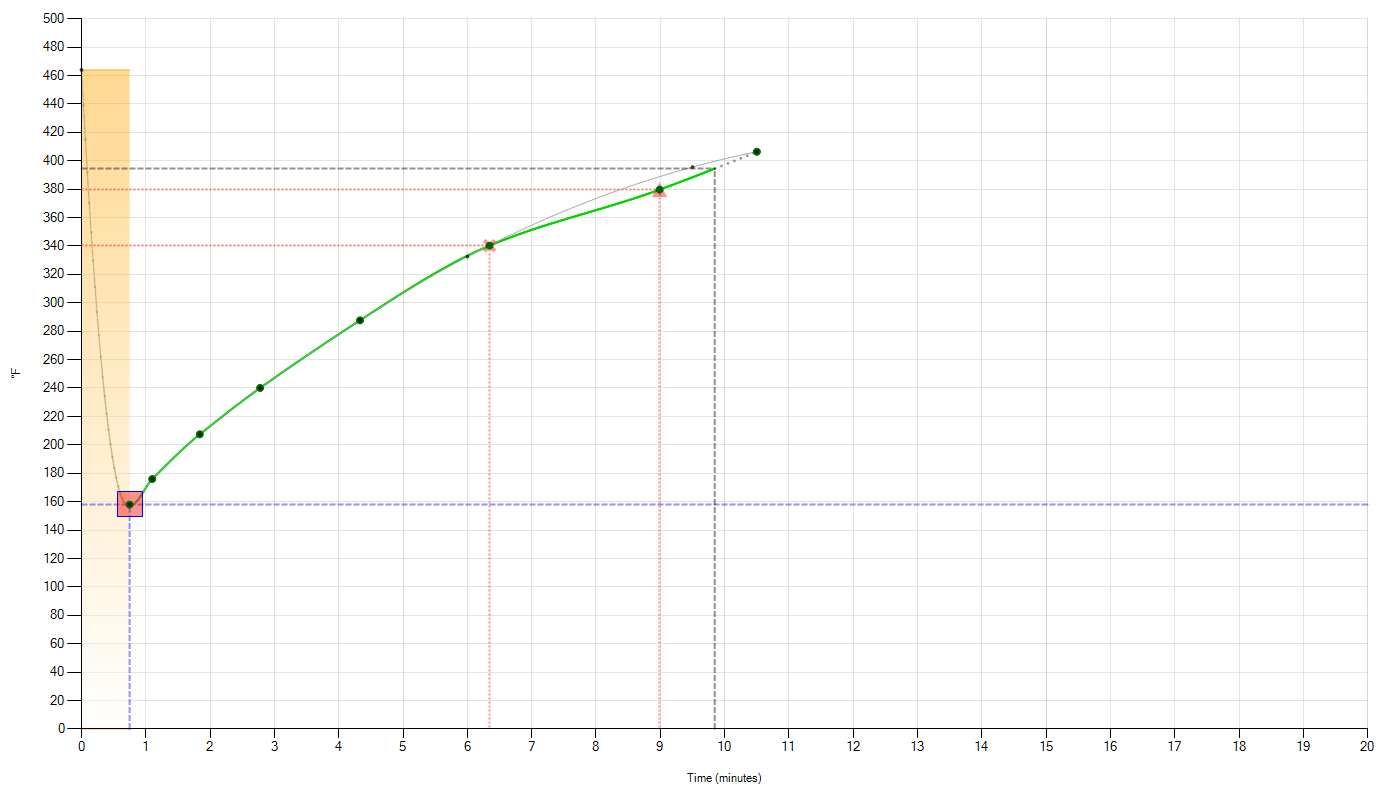
To view a Profile, load it from the local hard disk or from the HMI screen into Roast Architect, or create a new Profile. The screen should look like the one shown below. Opening a Profile may show the Profile in a view-only mode. The Profile and its attributes cannot be edited in this mode. Toggle the Edit button to enable editing mode.
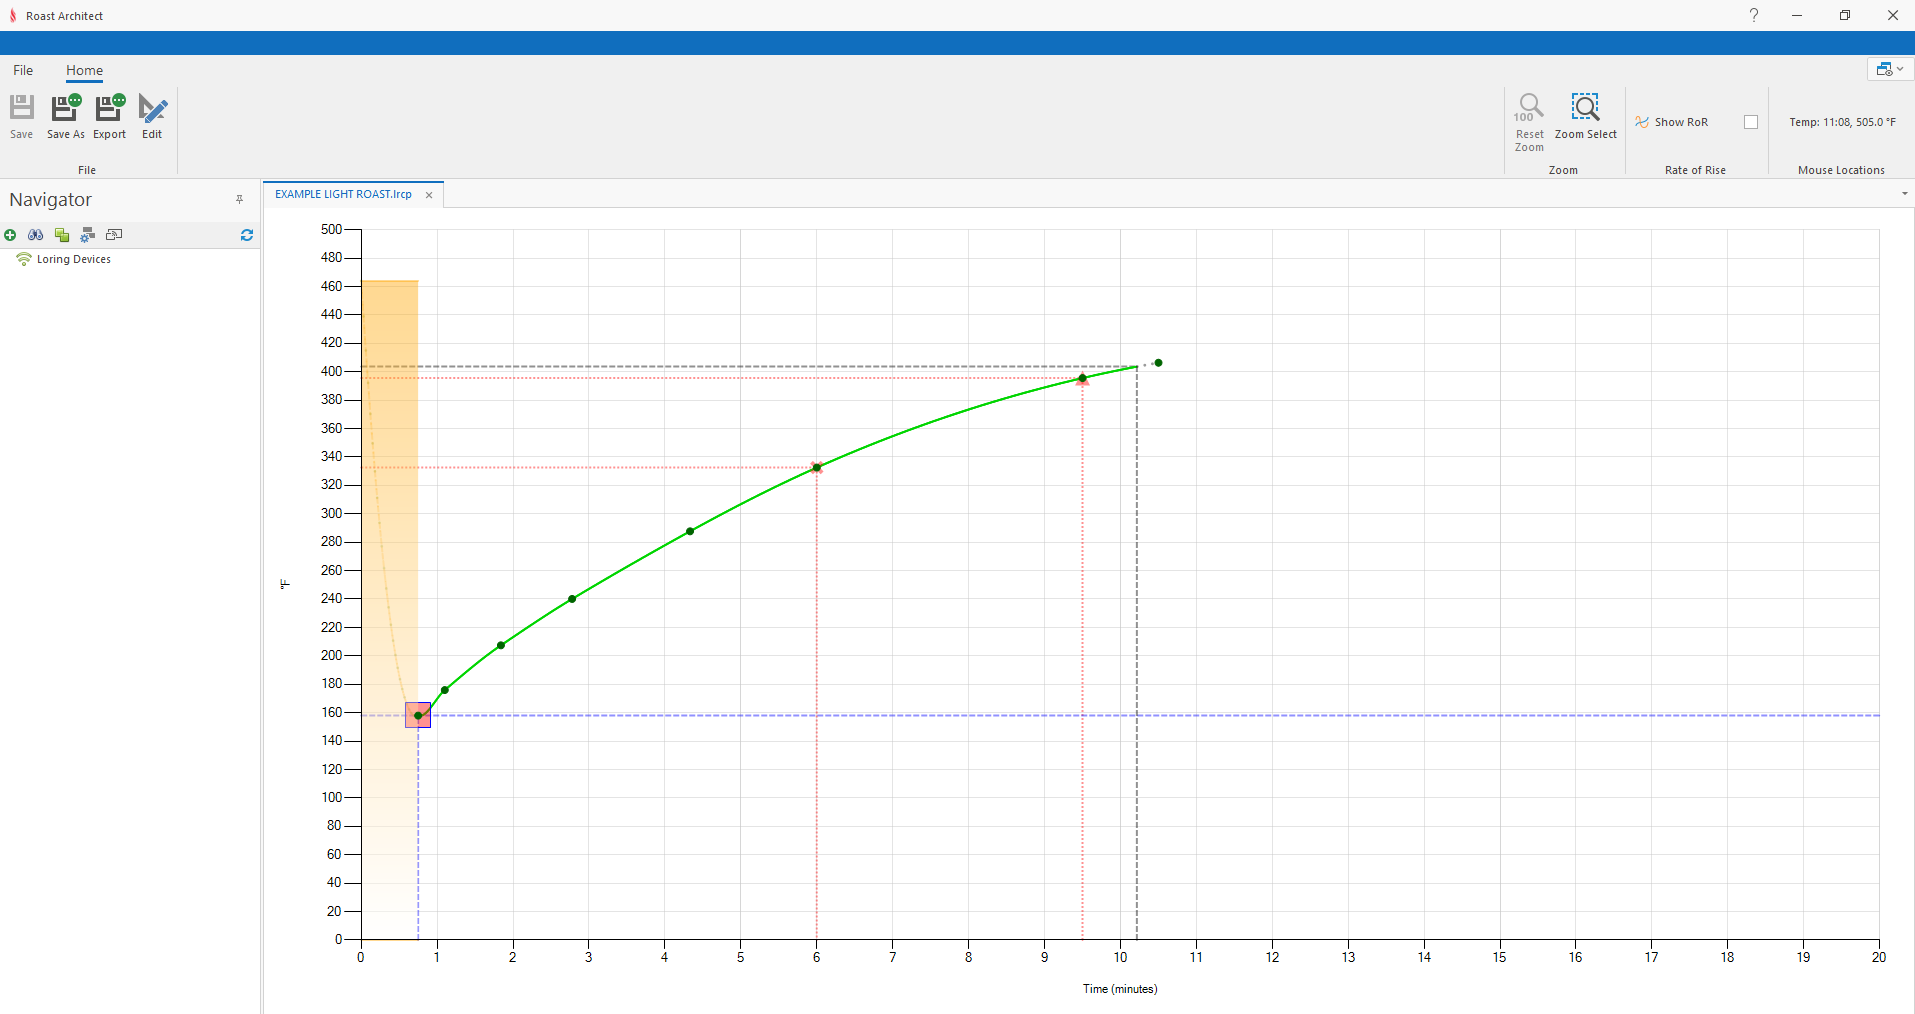
The Profile in view-only mode
Change to Burner Recipe
The Editing Tools appear differently according to which Edit mode you are using- Roast Profile or Burner Recipe. You may switch between the two Edit modes on the same Profile, and the saved file will retain changes from both Edit modes. However, the two Edit modes do not interact or affect one another. Note that if a completed Manual Roast is saved from a Loring Roaster, it will contain both a Roast Profile and a Burner Recipe in one Profile file.
If the Profile is to be used as a Burner Recipe, click Change to Burner Recipe

The Roast Profile attributes will all be saved when you switch to editing as a Burner Recipe, and vice versa. Remember, the two Edit modes do not interact or affect one another.
The Profile will be saved with the file type that corresponds to the Edit mode toggled at the time of saving (either Roast Profile or Burner Recipe) and this file type may influence its file location when uploaded to a Roaster.
Roast Profile Editor Ribbon Bar Tools
Edit
Toggles between Edit mode and view-only mode.
Save/Save As
Save the currently focused Roast Architect file
Save as creates a copy of the open Roast Architect file with a new name
Zoom Select
To zoom in on a specific time period, click the Zoom Select tool, then click and drag over the desired section of the timeline.
Reset Zoom
Reset the time scale to the default period.
Rate of Rise Display
Roast Architect has the ability to show a Rate of Rise (RoR) curve alongside the bean temperature curve. This is shown by checking the Show RoR check box.
Ribbon Bar Rate of Rise Check-Box
Once selected, the Rate of Rise curve is shown in dark blue. A secondary axis on the right-hand side of the graph will appear and shows the units of the Rate of Rise curve.
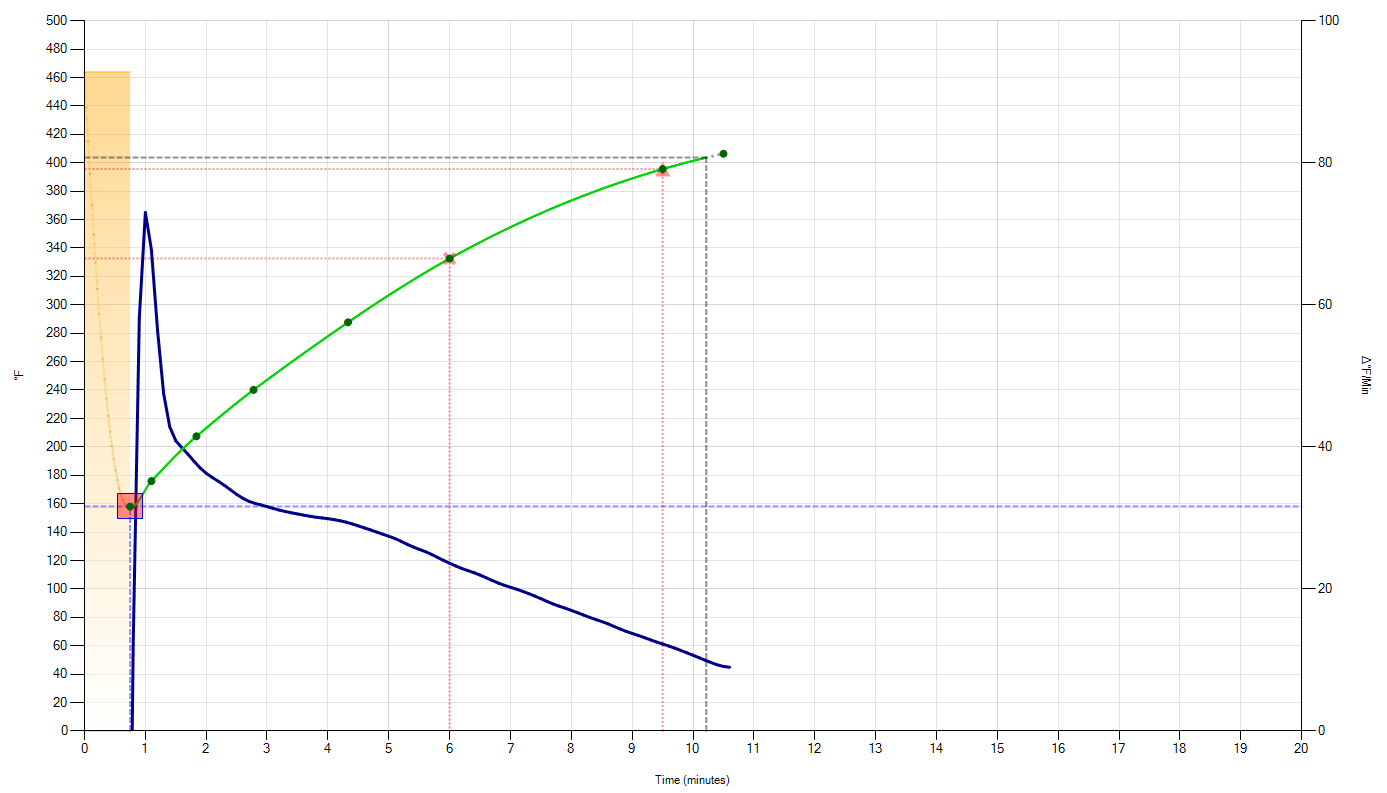
Profile with Show Rate of Rise enabled
Undo/Redo
Use the Undo and Redo buttons to revert unsaved changes.
Snap EoR to Max Temperature
Change the End of Roast Attribute to the temperature of the Profile's final point.
EoR Crop
Crops the Profile to the End of Roast temperature by adding a new anchor point at the EoR point, followed by removing all succeeding anchor points.
Change to Burner Recipe
Change the Edit mode from Roast Profile to Burner Recipe. This does not remove any prior unsaved changes made to the Profile.
Compare Original
Enable this feature to display the as-opened historical profile alongside the edited profile. This can be used to inform a roast designer what changes have been made to the profile during editing.
Profile with Compare Original enabled
The checkbox labeled "Update on Save" forces the historical profile to update to the current profile each time the Save control is used.
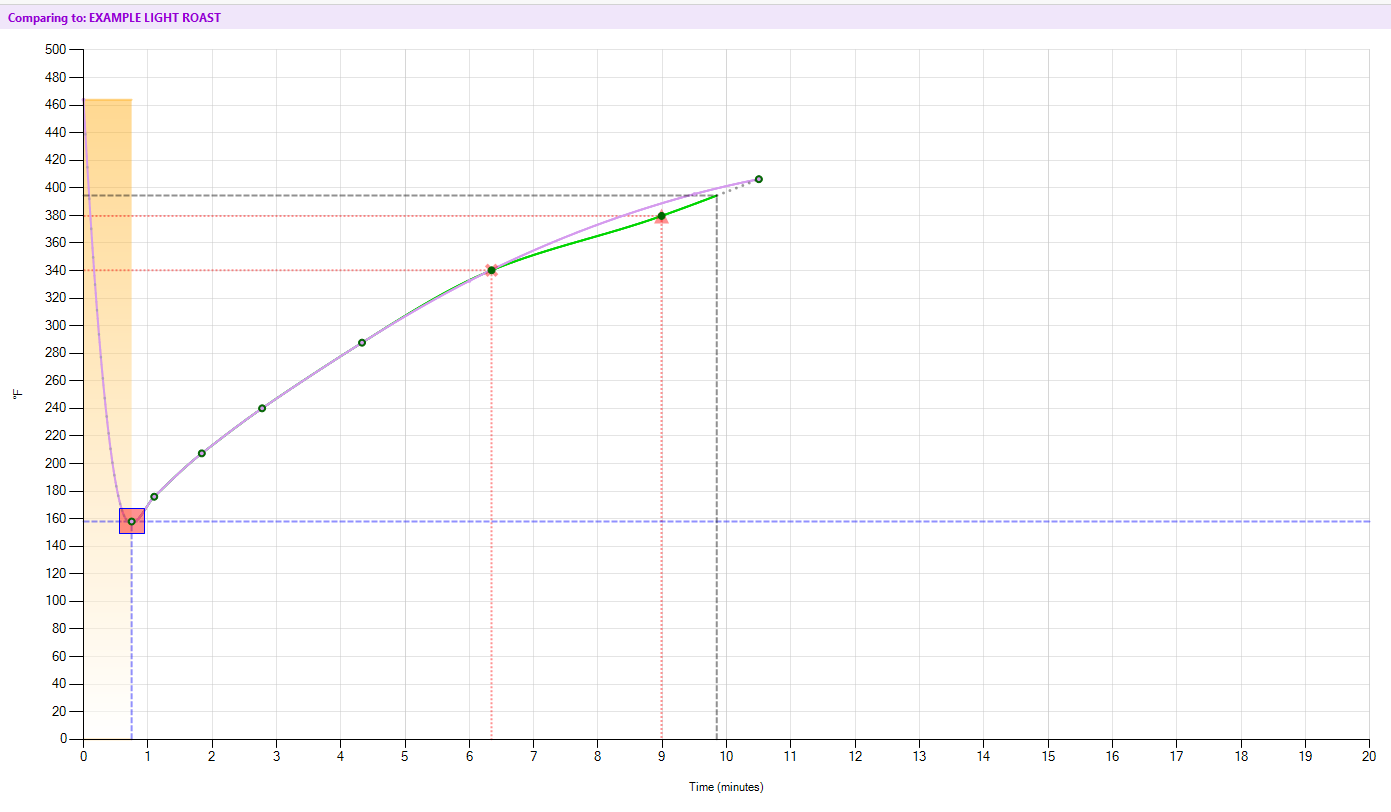
Compare to External Recipe
The new feature "Compare External (Ext.) Recipe" allows a designer to display (in purple) a second profile in the editor window, for comparison to the profile being edited. The comparison profile will not be affected by the editing process.
Navigating the Graph
The following actions are available to modify the view of the graph.
Zoom In: While viewing the Profile, you can zoom in on the time span by hovering your mouse over the graph and scrolling up with the mouse wheel. This will zoom in along the x-axis (time).
Zoom Out: To zoom out, scroll down with the mouse wheel until the full roast timeline is visible again.
Reset Zoom: To return the graph to its original zoom level, right-click anywhere on the graph and select "Reset Zoom" from the menu that appears (you can also use the ribbon bar tool.) This will return the x-axis to its full range.
Pan the Timeline: To move left or right across the zoomed-in roast timeline, use the scroll bar located at the bottom of the graph. Click and drag the scroll bar to pan across the entire roast span.
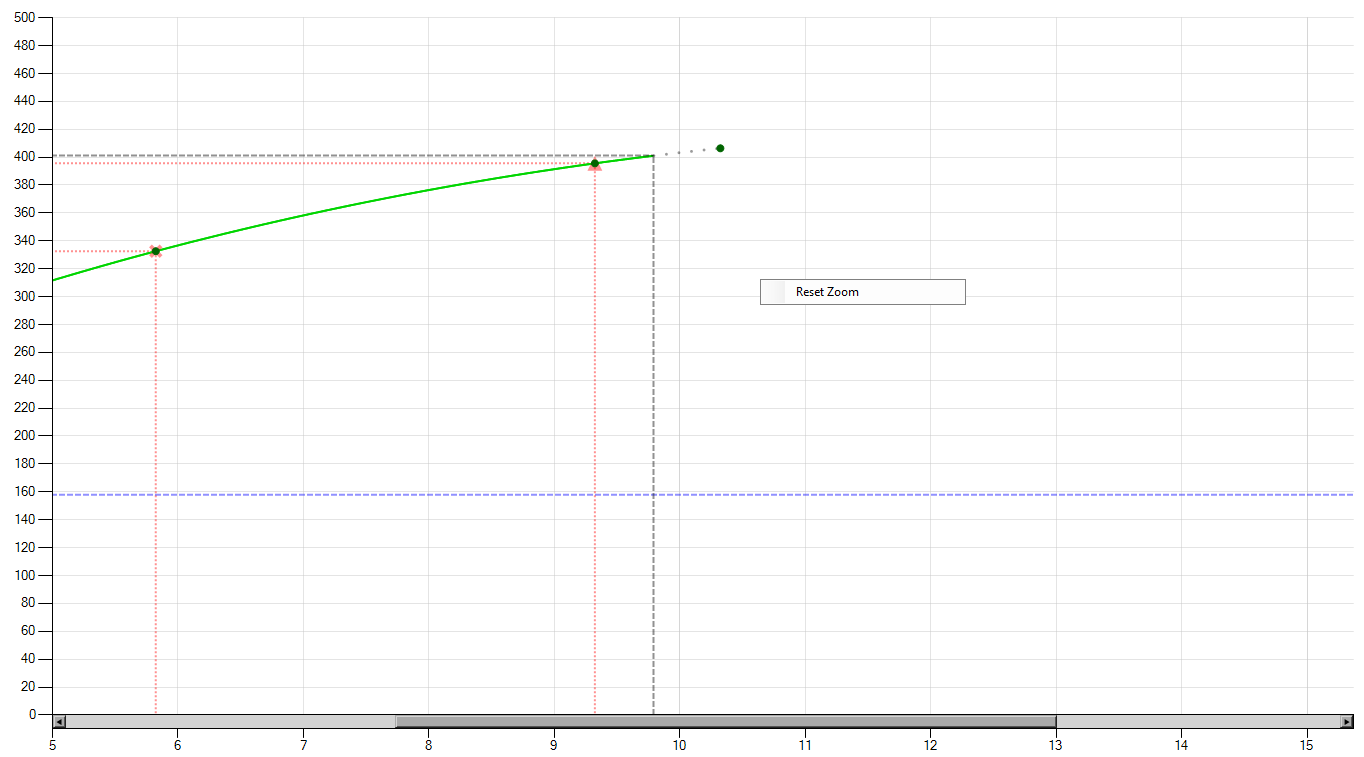
Zoom, Panning, and Reset Zoom
Highlighting
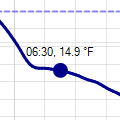
Hovering the mouse over the Rate of Rise curve will highlight the temperature point and show it for a brief moment for review.
Mouse Locations
Displays the location of the mouse on the graph. The coordinates will display the according temperature and the rate of rise at the mouse location. This does NOT display the highlighted temperature point on either the Bean Temperature or Rate-of-Rise curves.
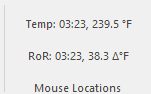
Ribbon Bar Mouse locations display
Editing a Profile
With Edit enabled, the Profile can be modified as desired. Roast Profile editing can be done two ways: Graphical Editing, and editing the Attributes. Using the graph, drag the Anchor Points to the desired position, or use the Attributes window to enter time and temperature values for the Anchor Points.
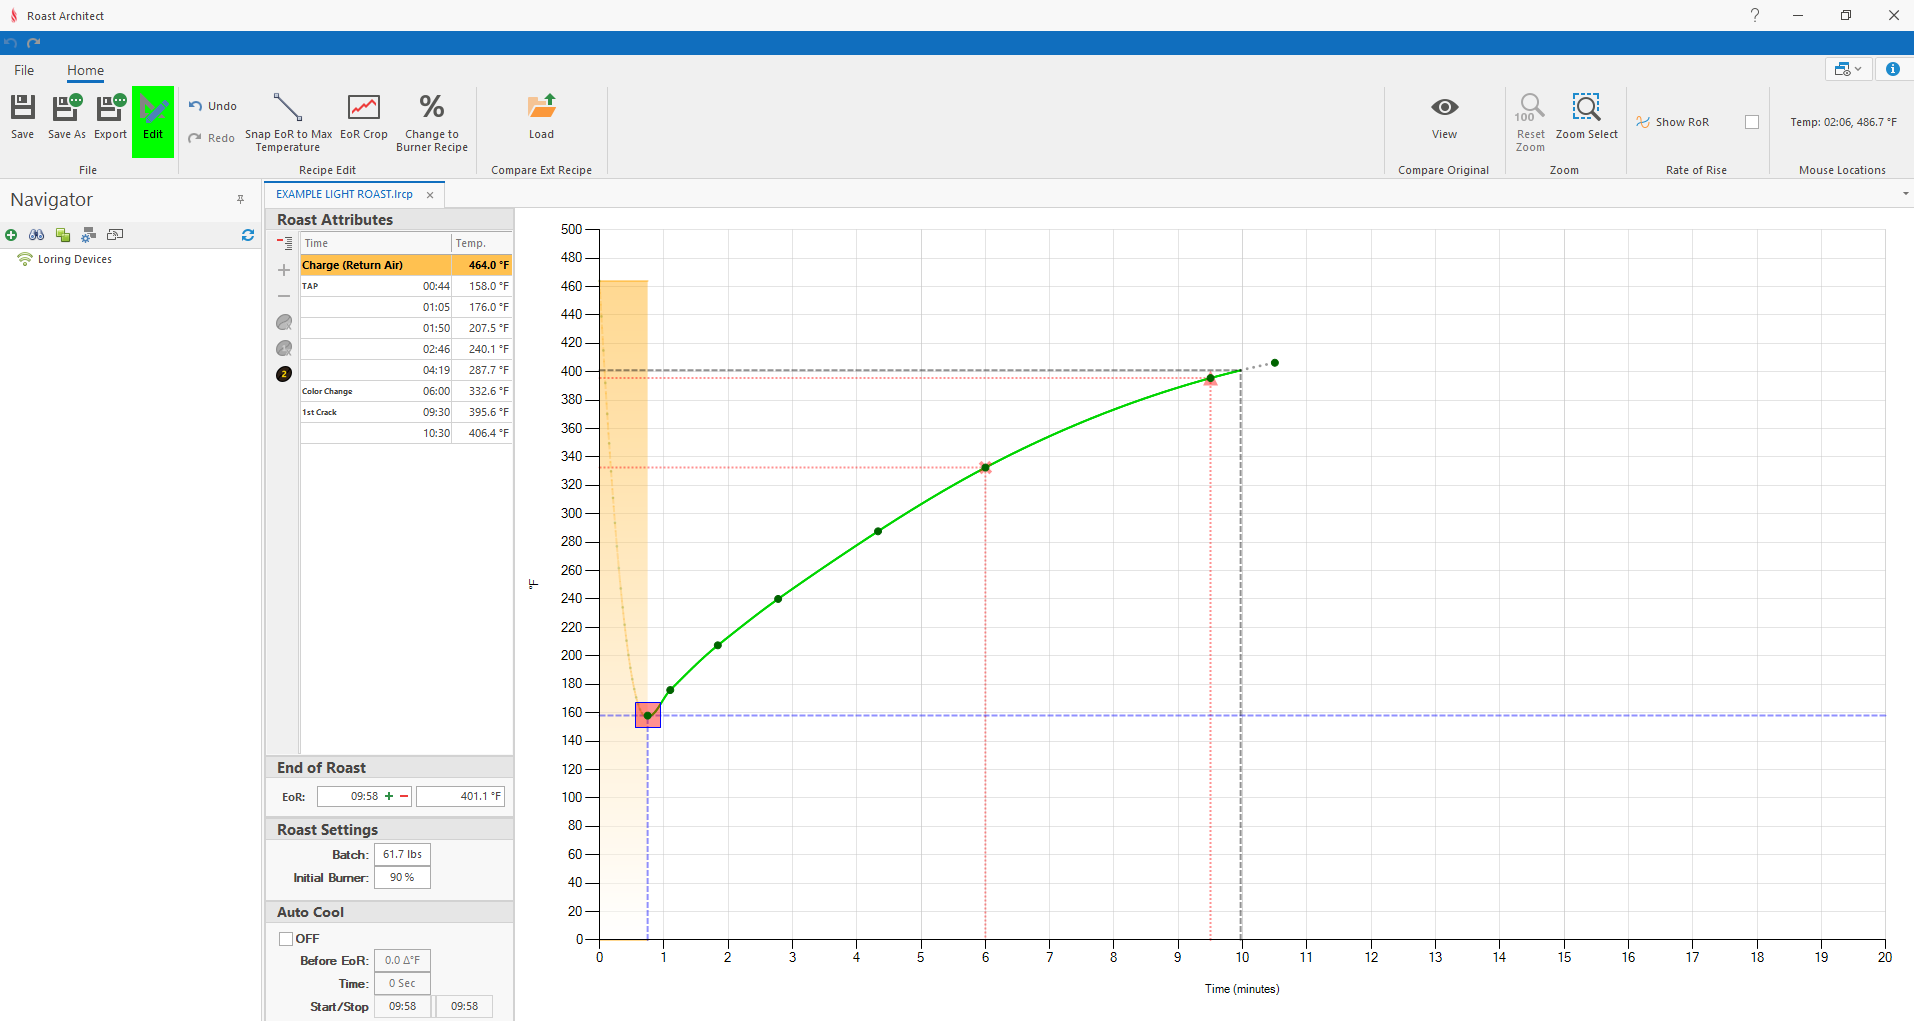
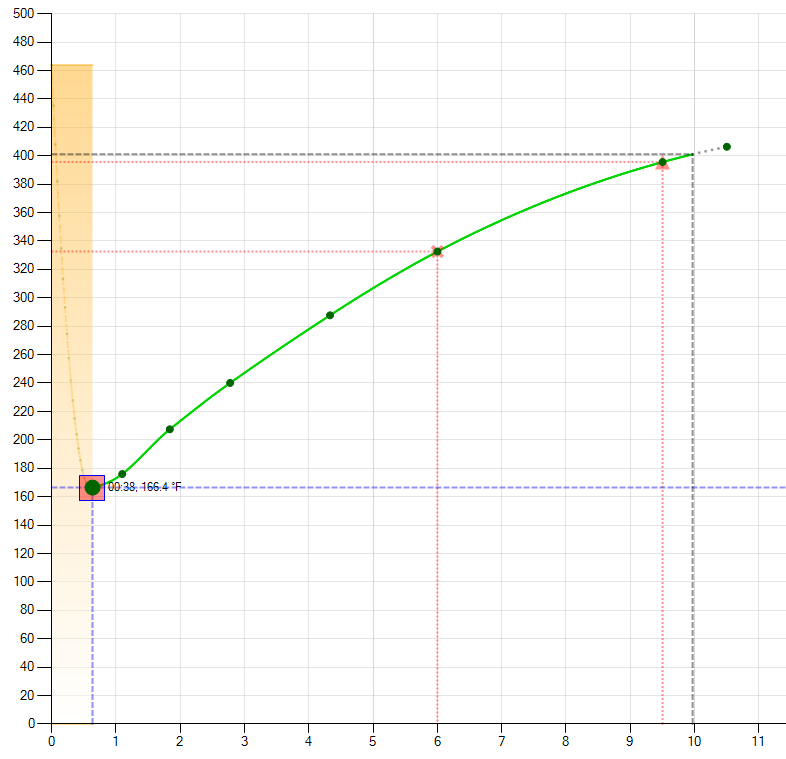
Roast Architect in Profile Editing mode
Anchor Points
An Anchor Point is a specific time and temperature point on the graph, and the number and placement of these Anchor Points define the Roast Profile. Anchor points are displayed on the graph as large points along the curve. They are also shown as numerical values in the Roast Attributes window.

An Anchor Point
Roast Attributes Window
The Roast Attributes window displays the parameters of the Roast Profile and the Anchor Points, which in turn define the Roast Profile curve.
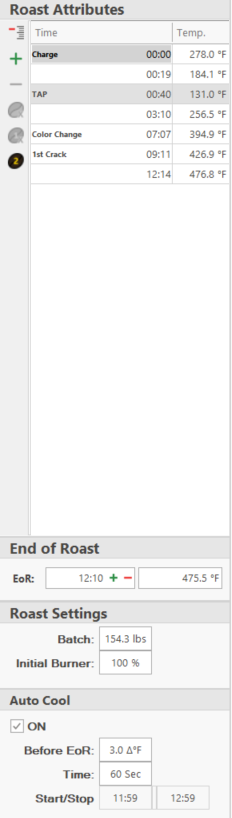
The Roast Attributes Window
Anchor Points Table
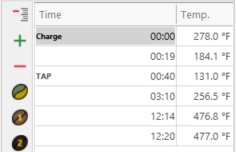
The Anchor Points table allows for the direct editing of Anchor Points. The time and temperature values can be input with a numerical keypad (MM:ss time formatting is required). The time can be incremented and decremented from the table entry. Dragging the Anchor Points using the graph will also modify the values in the Anchor Points table.

Editing and Anchor Point Table entry
Anchor Point Toolbar
From top to bottom, the toolbar functions:
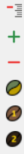
Collapse Table: Hides the Anchor Point entries that are not named points. Also hides the Add Point and Remove Point functions.
Add Point: Adds a new Anchor Point, after the currently selected point. Hidden if the Anchor Point Table is Collapsed.
Remove Point: Removes the currently selected point in the Anchor Point Table. Hidden if the Anchor Point Table is Collapsed.
Color Change, First Crack, and Second Crack: Adds the corresponding named Anchor Point. To remove a named Anchor Point, first select the Anchor Point (or click into the value field), then click on the icon to deselect it.
Named Anchor Points
There are several Anchor Points which are given specific names corresponding to common terminology within the roasting process. These can help a roast designer parameterize the key Anchor Points of a roast, and fine tune a final Profile around them. The named points are displayed with individual icons and leaders in the Roast Attributes window, and some have special indicators on the graph. Some points are optional, and can be added or removed from the Anchor Points toolbar. More information about TAP and EoR can be found later in this section.
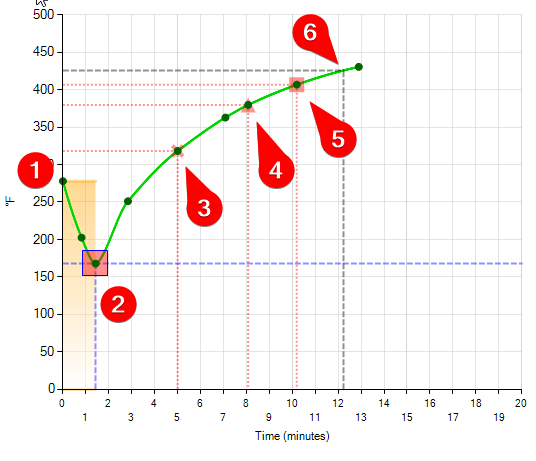
1. Charge 2. Turn-Around-Point (TAP) 3. Color Change 4. First Crack 5. Second Crack 6. End of Roast Temperature (EoR)
Charge: The temperature at which the roast begins. Due to the nature of the roasting process, the Bean Temperature will temporarily decrease from this temperature.
Turn Around Point (TAP): The time and temperature at which the Bean Temperature first increases after the Charge point. Indicated by a red square and a pair of intersecting purple, dashed lines.
Color Change: [Optional Point] The point at which coffee will be expected to first display roasting color (also know as yellowing). Displayed by a red X and a pair of intersecting red, dashed lines.
1st Crack & 2nd Crack: [Optional Points] The points at which coffee will be expected to undergo the First Crack and Second Crack changes. Each is indicated by a red triangle or square, and a pair of intersecting red, dashed lines.
End of Roast: The time and temperature at which the roast is expected to be completed. Indicated by a pair of intersecting grey, dashed lines.
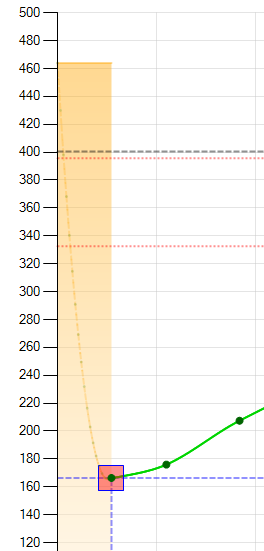
Turn Around Point (TAP)
The Turn Around Point is the time and temperature at which the Bean Temperature first increases after the Charge point. The TAP on the graph is not a target temperature, and represents an expectation, not a certainty. The actual Turn Around Point will be influenced during a real roast by the Charge temperature, Initial Burner Setting, batch weight, and the pre-heat state of the Roaster.
The Turn Around Point is not optional. It can be adjusted like other Anchor Points with either the Anchor Point Table, or by dragging it on the chart area. The TAP can additionally be adjusted by holding Left Ctl + Right Mouse to drag the TAP Leaders. Note that dragging the TAP leaders will scale the entire Profile curve.
Turn Around Point
End of Roast (EoR)
The End of Roast Parameter for a Profile is the temperature at which the roast is expected to be completed, and at which a Loring Roaster will complete an automated roast (Refer to the Loring Roaster Operator Manual).
The End of Roast temperature is not optional. It can be changed by entering a time or temperature value in the EoR section of the Roast Attributes window. When one parameter is entered, the other parameter will be automatically calculated according to the Profile. The EoR point can additionally be changed by holding either of the leaders with the mouse and dragging the leaders to the desired point of the Bean Temperature Profile on the chart.
The End of Roast time or temperature cannot be set greater than the time or temperature of the last Anchor Point on the Profile. If you set the End of Roast Temperature to less than the final Profile Recipe temperature, the profile line turns into a dashed line to indicate that the profile will only run to the EoR Temperature.
NOTE: If the EoR temperature exceeds the highest temperature of the Profile, a Loring Roaster will attempt to reach the EoR temperature very quickly. This may significantly increase the Burner Set point, and the EoR Time may be extended.
Roast Settings
Batch: The designed weight of the batch for this Profile. A Loring Roaster will use this weight to automatically adjust the Profile for use on smaller or larger batch sizes.
Initial Burner Setting: The Initial Burner Setting that will be used by a Loring Roaster after the completion of Charge, until after the TAP, at which point the Roaster will follow the Roast Profile. The Initial Burner Setting is indicated on the graph with an orange shaded area. The profile time between Charge and TAP is displayed as a dashed line to denote that the roaster is not following the profile until after the TAP.
Auto Cool
When enabled, the Auto Air Cool feature is triggered at a specified number of degrees before the EoR temperature. Auto Air Cool opens the Purge Gate at the back of the Roaster, and ramps the Burner to 100%. This is a smoke abatement feature that reduces the amount of Cooler Tray smoke by incinerating it before the roast is finished.
- When enabled, the Auto Air Cool feature will no longer complete the roast at the EoR temperature, but will complete the roast when the Air Cool Time has elapsed
- When enabled, the graph will display the designed Auto air cool period as a purple rectangle

The bar indicates the designed Auto Air Cool period on the Roast Chart
OFF/ON: Enable or Disable the Auto Cool function default setting for this Roast
Before EoR: Specify the amount of degrees before the End of Roast Temperature which Auto Air Cool will begin
Time: Length of the Auto Air Cool procedure
Start/Stop: The Expected times at which the Auto Air Cool procedure will begin and complete. The actual Start and Stop times may vary
Profile Scaling
The Entire Profile curve can be scaled by either Time or Temperature by holding Left Ctl and using the Right Mouse button to drag the EoR Leaders (Left Ctl + Right Mouse.)